
Data-driven decision making is the key to unlocking business success. As a seller on Selly Africa, you have access to a treasure trove of valuable insights that can help you optimize your listings, improve your sales strategy, and stay ahead of the competition. But, navigating the world of analytics can be overwhelming, especially for beginners. With Selly Africa’s analytics, you can uncover hidden trends, identify areas for improvement, and make informed decisions that drive growth. In this comprehensive guide, we’ll take you by the hand and walk you through the process of mastering Selly Africa’s analytics, from understanding key metrics to leveraging data to drive business success. Whether you’re a seasoned seller or just starting out, this guide will empower you to unlock the full potential of your Selly Africa shop and take your business to the next level.
Understanding Selly Africa’s Analytics: Key metrics and terms
As you dive into the world of Selly Africa’s analytics, it’s essential to understand the key metrics and terms that will help you unlock valuable insights about your business. At first, the array of numbers and graphs may seem overwhelming, but fear not! With a solid grasp of these fundamental concepts, you’ll be able to navigate the analytics dashboard with ease and confidence. From conversion rates to average order value, and from bounce rates to customer lifetime value, each metric provides a unique window into your business’s performance. Understanding what these metrics mean, how they’re calculated, and what they’re telling you about your customers will empower you to make data-driven decisions that drive growth and revenue. Absolutely, here’s a breakdown of key metrics and terms you’ll encounter when diving into website analytics:
General performance metrics
Sessions: The total number of times visitors interact with your website within a specific timeframe. A session can include multiple page views and last for a set period of inactivity (usually 30 minutes).
Page views: The total number of individual pages viewed on your website. High page views indicate visitors are engaged and exploring your content.
Users: The total number of individual visitors to your website within a specific timeframe. Note that a single user can generate multiple sessions.
Traffic acquisition metrics
Traffic sources: Where your website traffic originates from. Common sources include organic search (unpaid search engine results), direct traffic (people typing in your URL), referrals (other websites linking to you), and paid advertising campaigns.
Engagement metrics
Bounce rate: The percentage of visitors who leave your website after viewing only one page. A high bounce rate suggests your landing page might not be captivating visitors.
Average time on site: The average amount of time visitors spends browsing your website. A longer average time on site indicates visitors are engaged with your content.
Conversion metrics
Conversion rate: The percentage of visitors who complete a desired action, such as making a purchase, signing up for a newsletter, or downloading a file. A higher conversion rate signifies your website is effectively guiding visitors towards your goals.
Goal completions: The total number of times visitors complete a desired action on your website.
E-commerce specific metrics
Average Order Value (AOV): The average amount spent per order on your website. Analyzing AOV can help you determine pricing strategies and identify upselling or cross-selling opportunities.
Customer Acquisition Cost (CAC): The cost associated with acquiring a new customer through marketing efforts. Monitoring CAC allows you to evaluate the effectiveness of your marketing campaigns and optimize your budget allocation.
Additional key terms
Demographics: Data about your website visitors, such as age, location, and gender. Understanding your audience demographics allows you to tailor your content and marketing strategies for better engagement.
Segment: A subgroup of your website visitors categorized by specific criteria like demographics, interests, or browsing behavior. Segmentation allows for targeted marketing messages and content creation.
Funnel analysis: Analyzing the steps visitors take to complete a desired action, such as the checkout process on an e-commerce website. Funnel analysis helps pinpoint areas where visitors might be dropping off and allows for process optimization.
A step-by-step guide to setting up your Selly Africa analytics dashboard
In the ever-evolving world of e-commerce, data is your compass, guiding you towards informed decisions and optimized success. As a Selly Africa seller, having a well-configured analytics dashboard is vital for understanding your store’s performance, identifying areas for improvement, and ultimately maximizing your sales. This step-by-step guide will equip you with the knowledge to navigate the setup process and unlock the valuable insights waiting within Selly Africa’s analytics dashboard.
Before we begin: A few pointers
Locate the analytics dashboard: The exact location of the analytics dashboard within the Selly Africa seller platform might vary slightly depending on the specific interface version. However, it’s typically found within the “Seller Tools” or “Account Settings” sections. Look for a menu option labeled “Analytics,” “Reports,” or something similar.
Familiarize yourself with terminology: Understanding key terms like “sessions,” “conversion rate,” and “average order value” will be crucial for interpreting the data presented
Step 1: Accessing the dashboard
- Log in to your Selly Africa seller account.
- Navigate to the “Seller Tools” or “Account Settings” section (refer to your specific platform layout).
- Locate the menu option labeled “Analytics,” “Reports,” or something similar. This will take you to the analytics dashboard.
Step 2: Customizing your view (Optional)
Date range: Most dashboards allow you to select a specific date range for data analysis. Start by selecting a timeframe that aligns with your needs, such as the past week, month, or quarter.
Metrics: Some dashboards offer the ability to customize the displayed metrics. Here, you can choose to focus on specific areas like sales, traffic sources, or product performance.
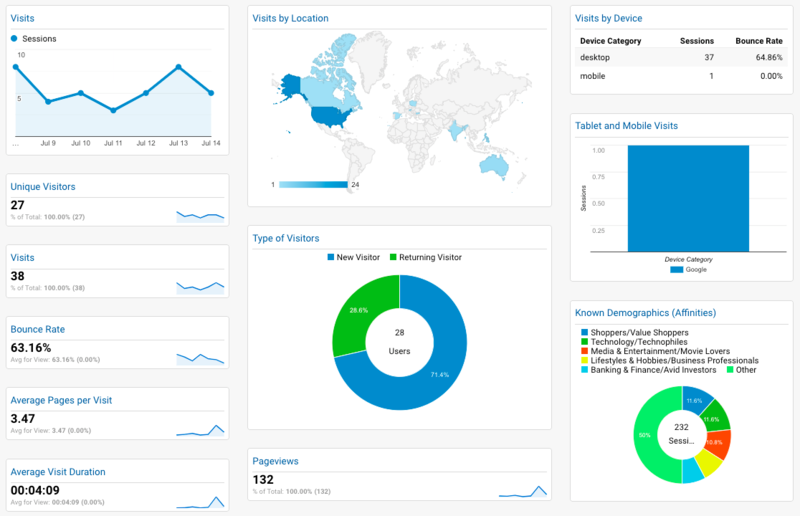
Step 3: Understanding key sections
Performance overview: This section provides a high-level summary of your store’s performance within the chosen timeframe. Common metrics displayed here include total sales, number of orders, and average order value.
Traffic sources: This section reveals where your website traffic originates from, such as organic searches, social media referrals, or paid advertising campaigns. This data is crucial for understanding how customers discover your store.
Product performance: Delve deeper into individual product data. Explore metrics like views, clicks, add-to-carts, and conversion rates to identify your top-selling products and areas for improvement.
Customer insights: Gain valuable insights into your customer demographics, such as location, age group, and browsing behavior. Understanding your target audience allows you to tailor your marketing strategies and product offerings for maximum impact.
Step 4: Setting goals and tracking progress
Define success: What are your e-commerce goals for your Selly Africa store? Do you aim to increase sales by a specific percentage or improve your conversion rate? Having clear goals will help you track your progress using the data provided.
Monitor key metrics: Regularly monitor the key metrics displayed within the dashboard. Are you on track to achieve your goals? Identifying trends and fluctuations in the data allows you to adapt your strategies as needed.
Turning data into actionable insights
Once you’ve familiarized yourself with these key metrics, it’s time to translate data into actionable insights that can propel your store forward:
Identify top-performing products: By analyzing product performance data, you can identify your best-selling products and replicate their success. Consider featuring these products prominently on your store homepage or in targeted marketing campaigns.
Optimize underperforming products: Are certain products struggling to gain traction? Analyze conversion rates and identify areas for improvement. Consider revising product descriptions, optimizing pricing, or enhancing product images to boost their appeal.
Understand your customers: Customer insights data empowers you to tailor your marketing strategies to resonate with your target audience. For example, if your data reveals a younger demographic, consider promoting your products on social media platforms they frequent.
Track traffic sources: Where is your website traffic coming from? Understanding traffic sources allows you to identify the most effective marketing channels and optimize your budget allocation.
Using Analytics to Fuel Your Sales Strategy: Powerful Tips and Best Practices
In the competitive world of sales, data is king. But data without direction is just numbers on a screen. By leveraging website analytics, you can gain a goldmine of customer insights that inform and optimize your sales strategy, propelling you towards success. Here are powerful tips and best practices to turn website analytics into actionable sales strategies:
Identify your ideal customer
Demographics: Analyze website visitor demographics like age, location, and gender. This paints a picture of who is most interested in your offerings, allowing you to tailor your sales approach and messaging accordingly.
Behavior analysis: Use website behavior data to understand how visitors navigate your site. What pages do they visit most? Where do they drop off? This unveils pain points and opportunities to optimize your sales funnel for a smoother customer journey.
Craft targeted messaging
Segmentation: Segment your audience based on demographics and behavior to deliver targeted messages. For example, tailor website content and outreach strategies to resonate with younger demographics versus established professionals.
Highlight customer needs: Analyze which products or services receive the most attention. Use this data to showcase these offerings in your sales pitches and marketing materials, directly addressing customer needs.
Optimize your sales funnel
Funnel analysis: Website analytics can reveal where potential customers abandon the sales funnel. Identify these drop-off points and optimize the user experience – streamline the checkout process, address confusing product descriptions, or provide clear calls to action.
A/B testing: Test different versions of your website landing pages, product descriptions, or calls to action to see which ones convert better. Data-driven A/B testing allows you to continually refine your sales approach for maximum impact.
Identify upselling and cross-selling opportunities
Product performance analysis: Identify your top-selling products and analyze which products are frequently viewed together. Use this data to recommend complementary products during the sales process, increasing your average order value.
Track and analyze sales performance
Marketing campaign attribution: Integrate website analytics with your CRM system to track which marketing campaigns are generating the most leads and sales. This allows you to optimize your marketing budget and focus on high-performing channels.
Sales team performance: Use sales data to track individual and team performance metrics. Identify top performers and analyze their strategies to share best practices and elevate your team’s overall sales effectiveness.
Embrace a culture of data-driven decision making
Regular reviews: Schedule regular meetings with your sales and marketing teams to review website analytics data and discuss customer insights. Foster a culture of data-driven decision making where strategies are constantly refined based on real customer behavior.
Invest in analytics tools: Consider investing in advanced website analytics tools that provide deeper customer insights and more granular data. These tools can empower you to make even more informed sales decisions.
Conclusion
In conclusion, mastering Selly Africa’s analytics is a powerful way to unlock the full potential of your e-commerce business. Understanding how to navigate and interpret the wealth of data at your fingertips, you’ll be able to make informed decisions, optimize your strategies, and drive growth. With the insights and tools provided by Selly Africa’s analytics, you’ll be empowered to refine your product offerings, improve customer engagement, and ultimately, boost your bottom line. Whether you’re a seasoned seller or just starting out, embracing the power of analytics will help you stay ahead of the competition and achieve your goals. So, take the first step today and start unlocking the insights that will propel your business to new heights.